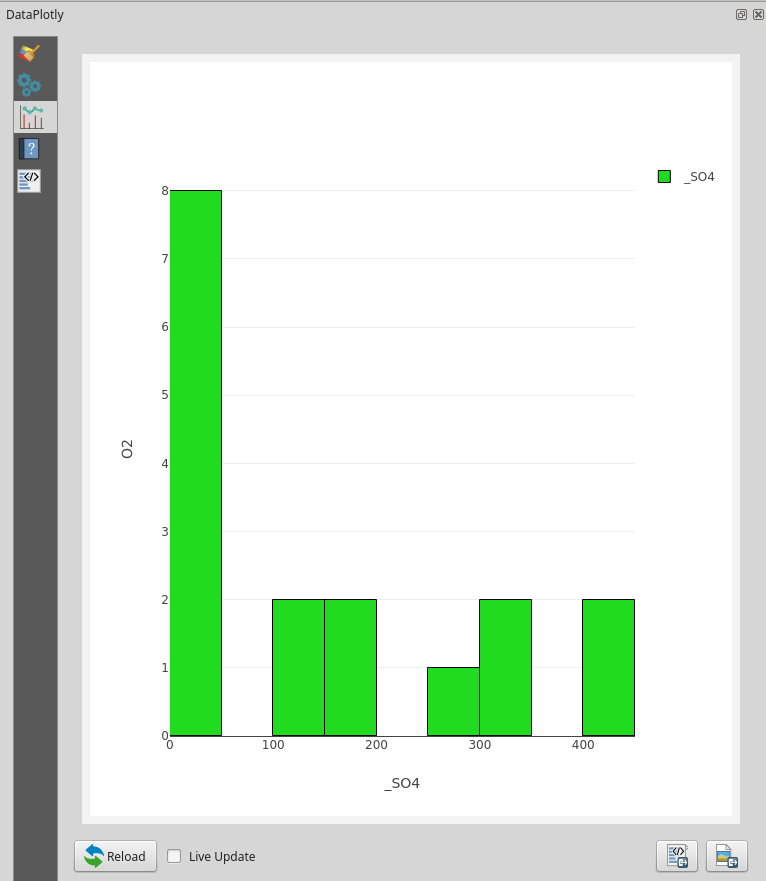
Histogram
Here you will find the guide to every parameter of the histogram. If you need more generic information please see DataPlotly Basic Usage.
Plot Properties
Layer: the combobox will display all the vector layers loaded in QGIS
X: the values in this field will be binned and the count in each bin will
be represented as the length of the bars
Marker Color: the color of the bars. To use different colors for individual
bars, enter an expression that returns an array of color definition strings
with as many elements as there are bars
For example
array('red','green','blue','yellow','purple')
or, to use colors from a color ramp
array_foreach(
  generate_series(0, 7),
  ramp_color( 'Blues', @element/7)
)
Stroke Color: border color
Stroke Width: the width of the border
Transparency: transparency level of the bar
Plot Customizations
Show Legend: show the legend of the current plot
Horizontal Legend: check if you want to have an horizontal legend
Plot Title: the plot title
Legend Title: the title of the legend
X Label: X label text
Invert X Axis: check if you want to invert the ordering of the x axis
Invert Y Axis: check if you want to invert the ordering of the y axis
Bar Orientation: the orientation of the bar, either Horizontal or Vertical
Bar Mode: choose if you want to group, stack or overlay the data
Normalization: different type of bins calculations are available
Cumulative Histogram: check if you want to create a cumulative histogram
Invert Histogram Direction: check if you want to invert the histogram direction (only if cumulative option is chosen)
Choose manually the bins: check if want to choose manually the bins number and
add a numeric value in the box
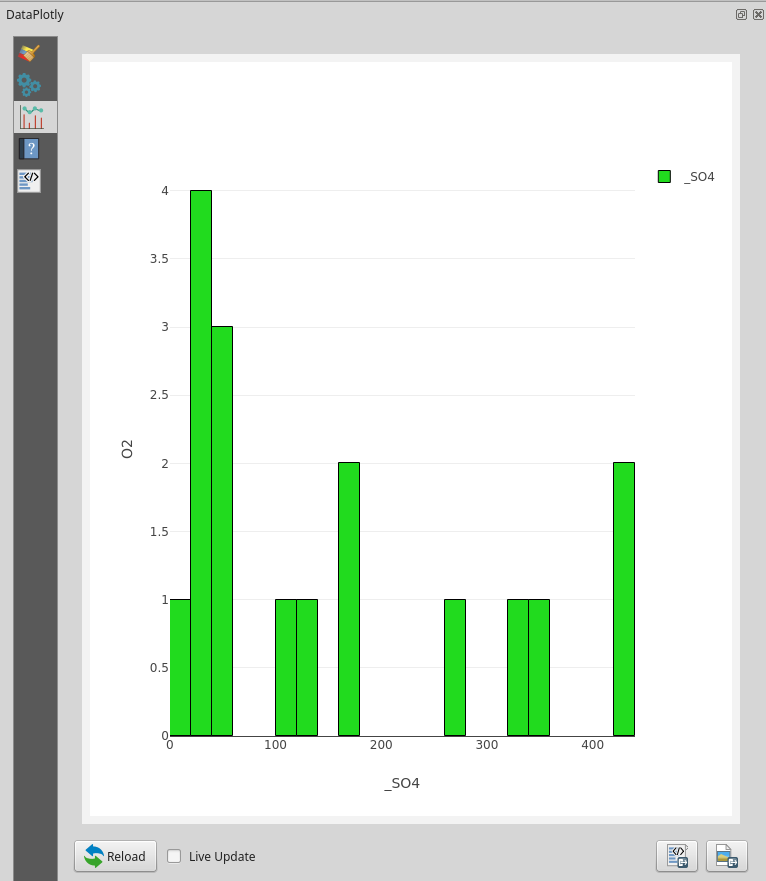
Bar gap: choose the space between the gaps, from 0 (no space) to 1 (maximum space)