Box Plot
Here you will find the guide to every parameter of the box plot. If you need more generic information please the DataPlotly Basic Usage.

Plot Properties
Layer: the combobox will display all the vector layers loaded in QGIS
Grouping Field (Optional): the grouping field. If no field is added, a generic
box plot for the Y value will be displayed
Y Field: the Y field
Marker Color: color of the box
Stroke Color: border color
Stroke Width: the width of the border
Transparency: transparency level of the box
Plot Customizations
Show Legend: show the legend of the current plot
Horizontal Legend: check if you want to have an horizontal legend
Plot Title: the plot title
Legend Title: the title of the legend
X Label: X label text
Y Label: Y Label text
Invert X Axis: check if you want to invert the ordering of the x axis
X Axis Mode: choose between Linear, Logarithmic or Categorized
Invert Y Axis: check if you want to invert the ordering of the y axis
Y Axis Mode: choose between Linear, Logarithmic or Categorized
Box Orientation: the orientation of the box, either Horizontal or Vertical
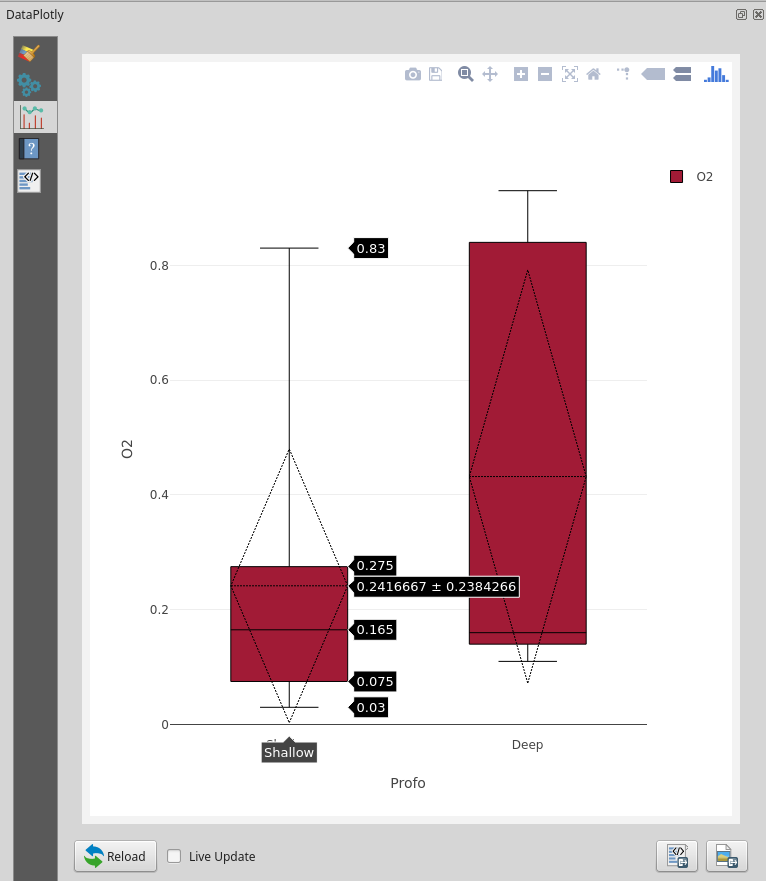
Show Statistics: choose to show also additional statistics on each box plot,
like the mean or the standard deviation (shown in the picture below)
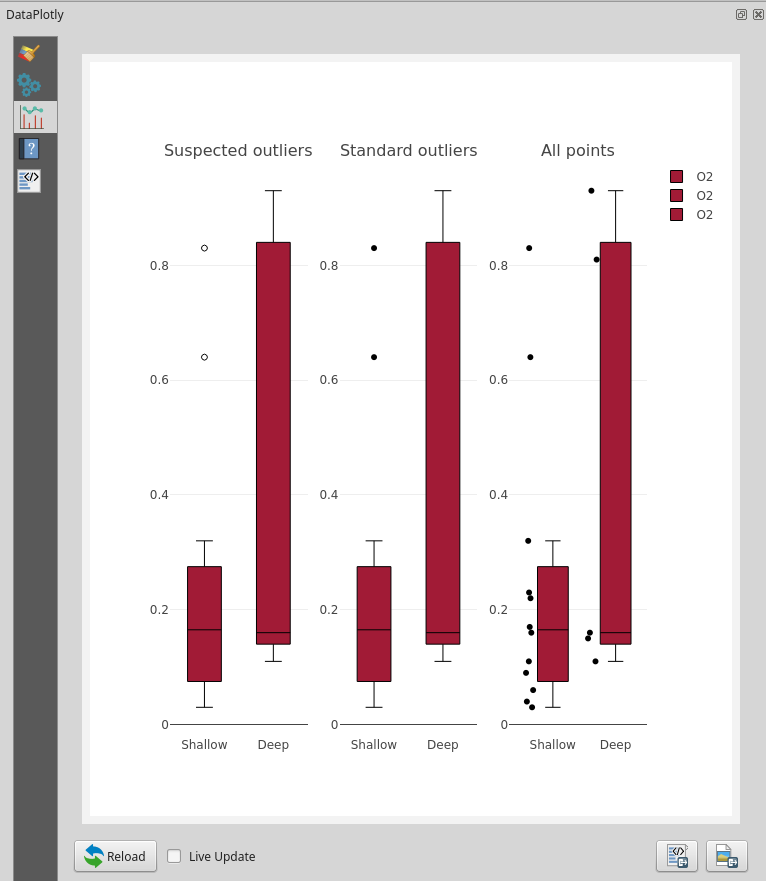
Outliers: show also the outliers (or all the points) next to the box. Some
example in the following picture: