Contour Plot
Here you will find the guide to every parameter of the contour plot. If you need more generic information please see DataPlotly Basic Usage.
Plot Properties
Layer: the combobox will display all the vector layers loaded in QGIS
X Field: the X field
Y Field: the Y field
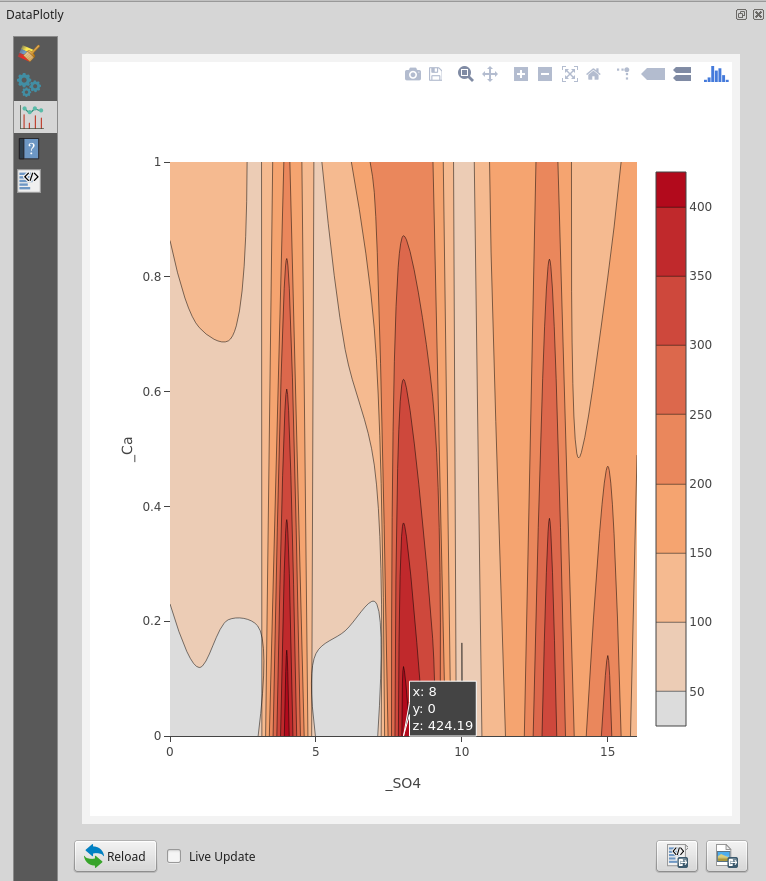
Contour Type: choose the type of countour:
Fill: the plot is filled everywhere: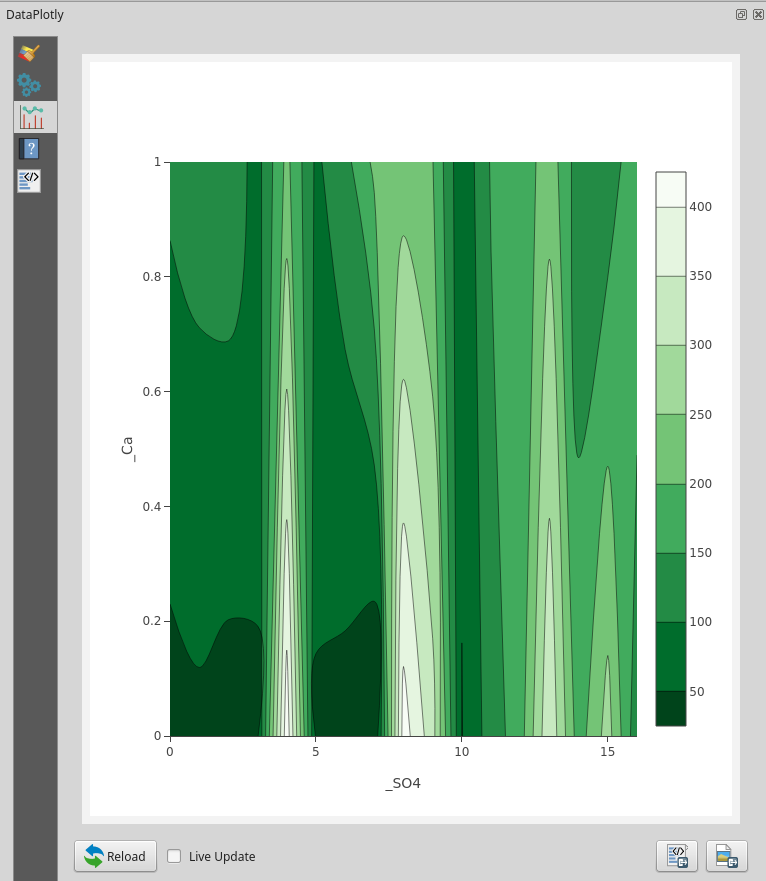
Heatmap: a heatmap like plot will be created: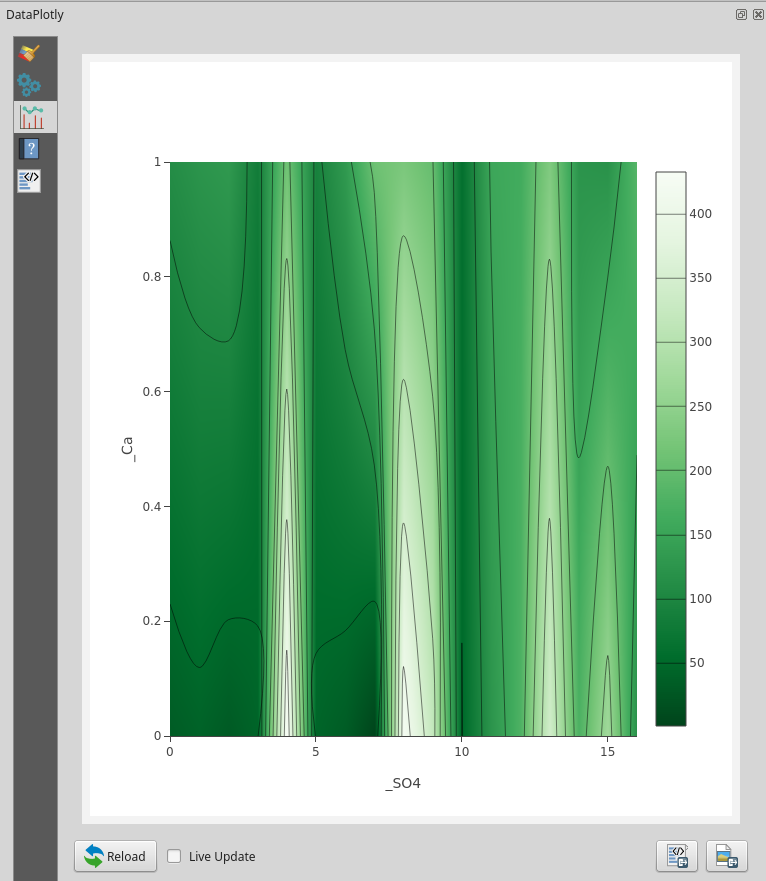
Only Lines: only the contour lines will be displayed: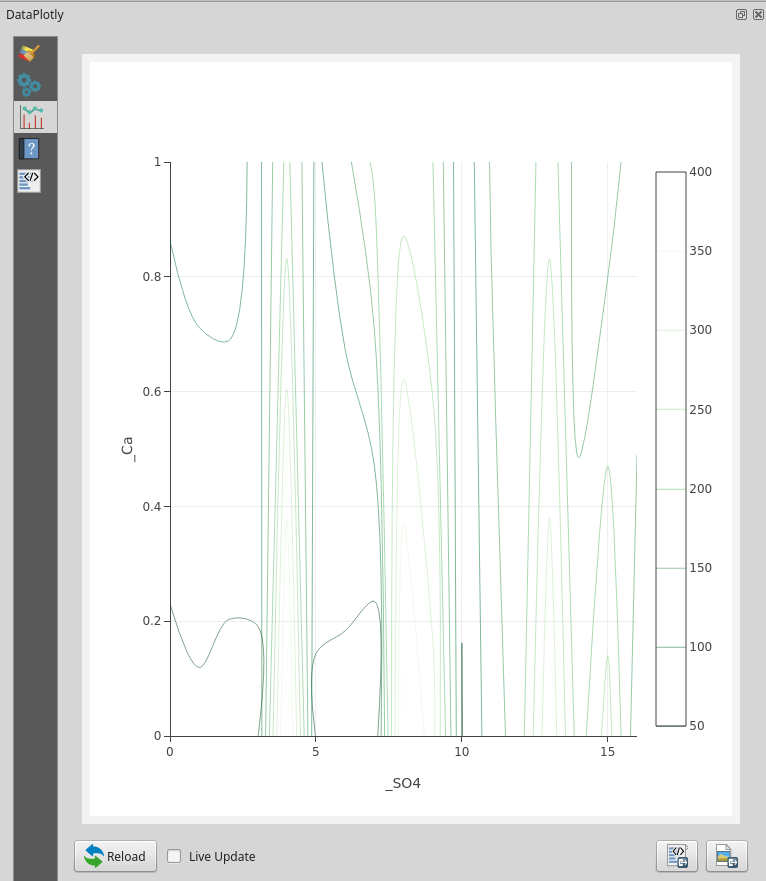
Show Lines: uncheck if no contour lines should be added to the plot
Color Scale: choose between many different color scales
Plot Customizations
Show Legend: show the legend of the current plot
Plot Title: the plot title
Legend Title: the title of the legend