2D Histogram
Here you will find the guide to every parameter of the 2D Histogram plot. If you need more generic information please see DataPlotly Basic Usage.
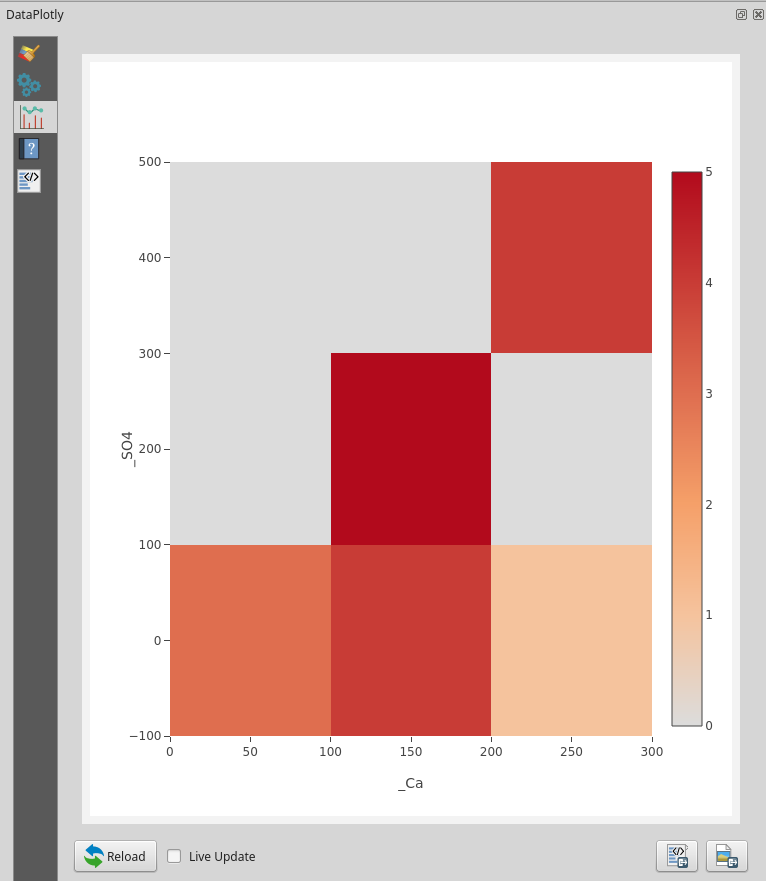
Plot Properties
Layer: the combobox will display all the vector layers loaded in QGIS
X Field: the X field
Y Field: the Y field
Color Scale: choose between many different color scales
Plot Customizations
Show Legend: show the legend of the current plot
Plot Title: the plot title
Legend Title: the title of the legend
X Label: X label text
Y Label: Y Label text
Invert X Axis: check if you want to invert the ordering of the X axis
Invert Y Axis: check if you want to invert the ordering of the Y axis